
Exam TDS-C01 Topic 2 Question 38 Discussion
Actual exam question for Tableau's TDS-C01 exam
Question #: 38
Topic #: 2
Question #: 38
Topic #: 2
Using the Time Series table, create a chart that shows the percent difference in Average Inventory on Hand for each Assortment by year and quarter.
How many quarters did the Electronics Assortment show a negative percent difference in the Average Inventory On Hand?
How many quarters did the Electronics Assortment show a negative percent difference in the Average Inventory On Hand?
Suggested Answer: C Vote an answer
If you chose 2, then you were very close but probably didn't plot the actual Percent Difference on your view. ( One of the marks is just over the line).
* Firstly, Drop the Week ID onto the column shelf, and convert it to continuous since we need both Year and Quarter as mentioned in the question.
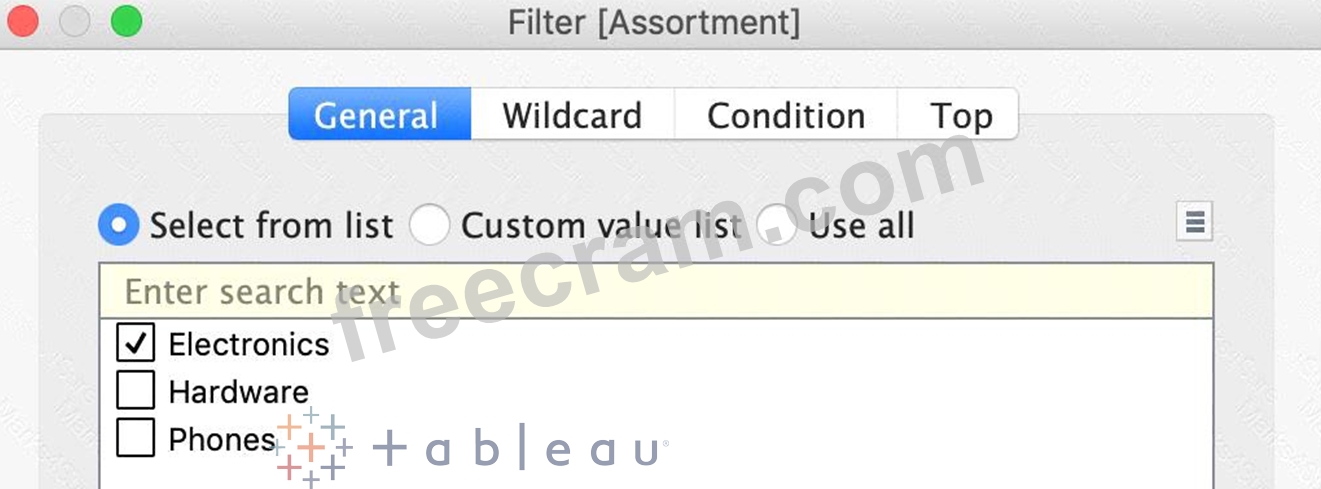
* 2) Next, Drop assortment to filters shelf so that we can focus on Electronics!
3) This should be your view now. Click on the Show Mark Labels icon as shown:
The final view is as follows, with 3 points below 0 ( i.e negative )

* Firstly, Drop the Week ID onto the column shelf, and convert it to continuous since we need both Year and Quarter as mentioned in the question.
* 2) Next, Drop assortment to filters shelf so that we can focus on Electronics!
3) This should be your view now. Click on the Show Mark Labels icon as shown:
The final view is as follows, with 3 points below 0 ( i.e negative )
by Truda at Jul 12, 2026, 10:56 PM
0
0
0
10
Comments
Upvoting a comment with a selected answer will also increase the vote count towards that answer by one. So if you see a comment that you already agree with, you can upvote it instead of posting a new comment.
Report Comment
Commenting
You can sign-up / login (it's free).